The University of Texas Electoral College Study.

What is the probability that the popular vote winner will lose the Presidency?

How likely is it that courts, not voters, will decide the Presidency?

UT-Austin researchers apply econometrics and Monte Carlo simulations to find the answers.

Simulations based on historical data reveal that inversions are more likely than previously understood.

in·ver·sion (noun) 1. mismatch between the candidate who wins the popular vote and the candidate who wins the election, esp. in US Presidential races: Hey, isn't it weird that we keep having inversions?

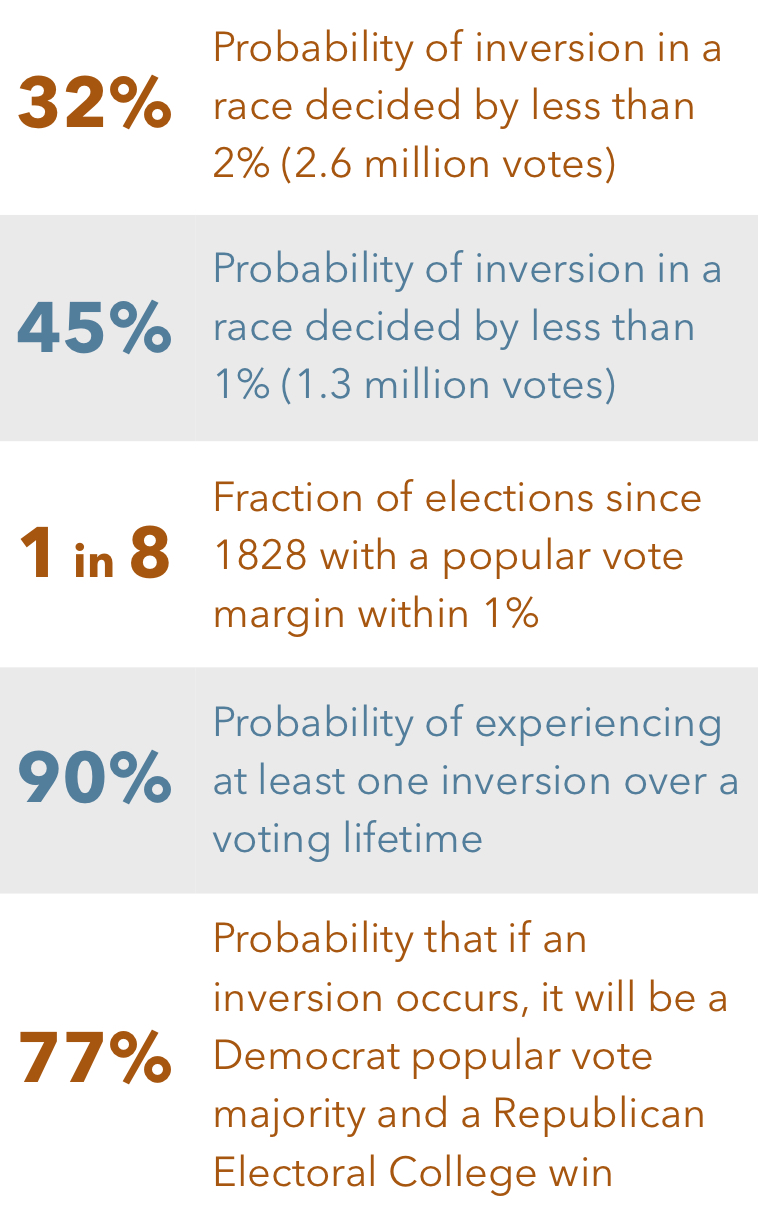
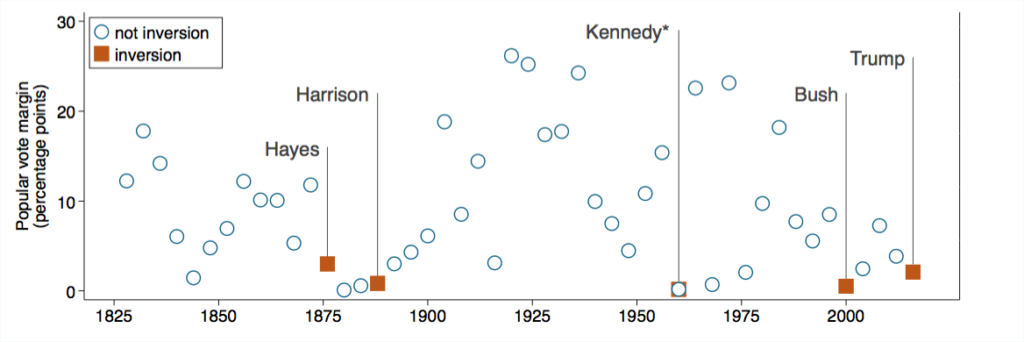
There have been four times when the winner of the Presidency did not receive the most votes: 1876, 1888, 2000, and 2016. What has been unclear until now is how often we should expect these electoral inversions. Was it statistically probable or was it a fluke that the Electoral College would have generated four inversions in the last two centuries?

New research from the University of Texas Electoral College Study (UTECS) provides an answer, using Monte Carlo simulations that generate probability distributions over the likelihood of inversions in elections extending back to 1836.

History tells us that Bush vs Gore 2000 was an inversion. The UTECS analysis tells us that this outcome was more likely than not, given the narrow Democratic margin of victory in the national popular vote. UTECS also tells us that more inversions are very likely in the future.

Data journalists and election forecasters have recently applied increasingly sophisticated statistical tools to analyze politics. They predict results of particular elections, such as Trump vs Clinton in 2016 in the weeks before ballots are cast. But they do not answer one of the deepest questions about the Electoral College:

How likely are inversions as an enduring feature of American political life, independent of two particular candidates or parties?

UTECS analysis makes clear that more inversions are likely in 2020 and beyond. Inversions will be business-as-usual in close elections under the Electoral College system.

Historically, elections decided by small margins often result in inversions.

*Depending on the particular judgement call one makes for counting ballots in Alabama in 1960, Kennedy either narrowly won or narrowly lost the popular vote.

UTECS methodology:
Statistical modeling and simulation

To determine what is likely to happen nationally in a Presidential election, the UTECS team begins by specifying a statistical model that describes a range of possibilities for each state’s election outcomes.

Using historical data, we estimate parameters of the model. These parameters describe how widely state outcomes vary across election years and how outcomes tend to covary across certain groups of states.

We then make random simulation draws from the estimated model to produce a probable election outcome in each state. Summing voting results across states gives us a simulated national result, including a national popular vote (NPV) winner and an Electoral College (EC) winner. Doing this many times tells us about the distribution of possibilities at the national level.

Combining many such simulation draws in this way is called Monte Carlo simulation. We draw about 100,000 simulated elections. By observing the frequency of events in the simulation, we can infer the probability of those events.

For example, the probability that Republicans win the Presidency with 49.0% of the national popular vote is just the fraction of times we observe that happening in the simulations. In fact, the probability that Republicans win elections in which they receive 49.0% of the vote is about 30%.

We calculate these probabilities for each potential national popular vote outcomes, tracing a function that describes these probabilities.

What would this function look like if the Electoral College always delivered the Presidency to the candidate with the most votes?  A step function.

If the EC always mirrored the NPV outcome, then any race in which a candidate received as little as a single vote more than their competitor, they would jump from certain defeat to (0%) to certain victory (100%).

In contrast, the simulations show that Republicans and Democrats both will win some elections in which they get the fewest votes and loose some elections in which they get the most votes.

What the Simulations Tell Us

The UTECS analysis shows that inversions are surprisingly likely, especially in close elections. The Presidential candidate with the most votes will lose 45% of elections decided by 2 percentage points or less (about 2.6 million votes by 2016 turnout).

This is a long-run property, not a modern phenomenon. Electoral College inversions have been very likely in close elections since the 1800s.

Even as rules and norms governing Presidential elections have changed over the centuries, including empowering an ever larger fraction of the population to have and to use the right to vote, and even as new parties have emerged and new states have joined the US, inversions have endured as a fact of Presidential politics and a likely outcome of close elections.

If elections continue to be as close as they have been in the last 30 years, it is near certainty that Americans who vote for the first time in 2020 will eventually experience an inversion over a 60-year voting lifetime.

Over the last 30 years, the probability that if an inversion occurs, it would have been a Democratic popular vote majority and a Republican Electoral College win has been about 70%.

Although it has not yet happened (except arguably in the case of Kennedy in 1960),  there is a significant possibility that a Democrat will win the Electoral College in a future race in which a Republican wins the popular vote.

No change to the Electoral College other than a national popular vote would eliminate the risk of electoral inversions. Not removing the two Electors corresponding to Senators, which skews representation towards smaller states. Not changing the winner-takes-all method by which most states award EC ballots.

This is because many factors cause inversions. Popular vote totals depend on the number of voters, but Electors are allocated based on the number of persons in the last census—including children and adults who cannot vote.

Because such simulations are in principle sensitive to modeling choices, we repeat the process many times under alternative assumptions about how common factors affect voting outcomes across states. For example, how important are region-specific shocks? Shocks linking states with similar racial compositions?

Some findings are sensitive to alternative sets of assumptions. But, somewhat to our surprise, the high rate of electoral inversions in close elections holds under any plausible model of how state elections unfold.

In other words, we do not need to agree on the perfect election model to know that a high probability of a mismatch between the popular vote winner and the Electoral College winner has been a constant feature of Presidential politics throughout US history.

Our Research Team

Prof. Michael Geruso (PhD) is an applied microeconomist at UT Austin who studies a variety of topics in public economics. He is a Faculty Research Fellow at the National Bureau of Economic Research. Prior to joining UT Austin, Mike was a postdoctoral fellow at Harvard University funded by the Robert Wood Johnson Foundation. Mike (along with Dean) is a Harry S Truman Scholar.

Dean Photo
Prof. Dean Spears (PhD) is an economic demographer at UT Austin whose research is at the intersection of economics and population. Dean is a founding Executive Director of r.i.c.e., and is an affiliate of IZA and of the Climate Futures Initiative at Princeton University. His research spans topics in development, air pollution and climate change, and the population dimensions of social well-being.
Ishaana Photo

Ishaana Talesara is a pre-doctoral research fellow with the University of Texas Electoral College Study. She previously worked as a summer research fellow for the Energy Policy Institute at the University of Chicago and as an intern with Annie’s List. Ishaana studies economics and math at UT Austin. In her independent work, she examines the cultural determinants of family formation and separation. 

Close Menu